Institutional Insights: BofA - SPX in need of stability/retest to bottom
SPX Daily Analysis: The "A" low is established, but will there be a retest to form a 1H bottom?
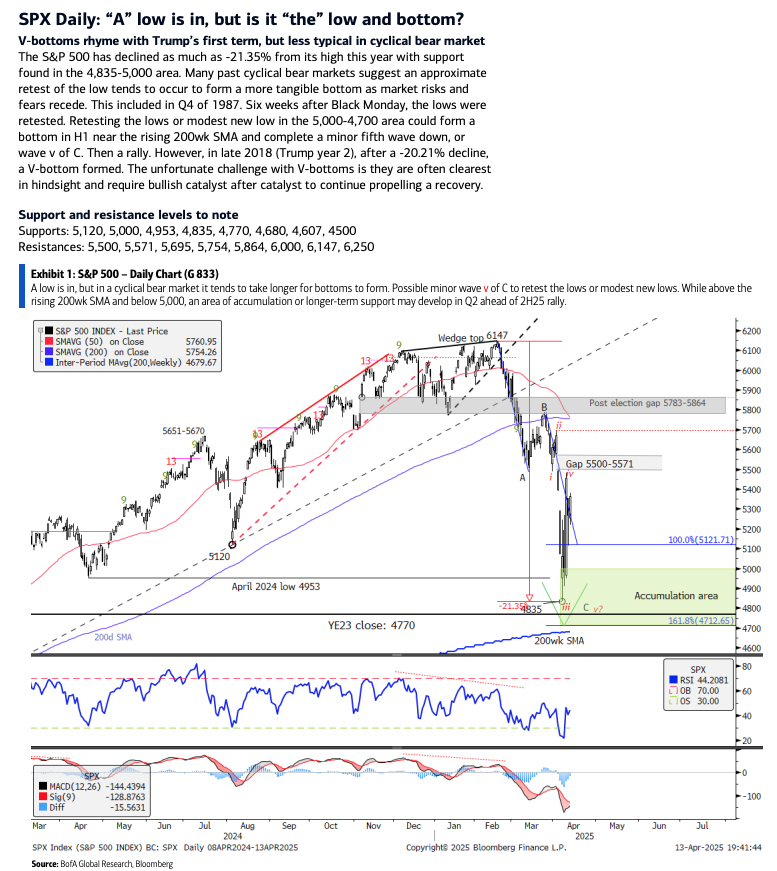
The S&P 500 has dropped by as much as 21.35% from its peak this year, finding support in the 4,835-5,000 range. Historical cyclical bear markets often indicate a retest of the low to establish a more solid bottom as market risks and fears diminish. This was observed in Q4 of 1987 when the lows were retested six weeks after Black Monday. A retest or modest new low in the 5,000-4,700 area could form a bottom in H1 near the rising 200-week SMA and complete a minor fifth wave down, or wave v of C, followed by a rally. However, in late 2018, after a 20.21% decline, a V-bottom formed, which poses challenges as they are often only clear in hindsight and require continuous bullish catalysts for recovery.
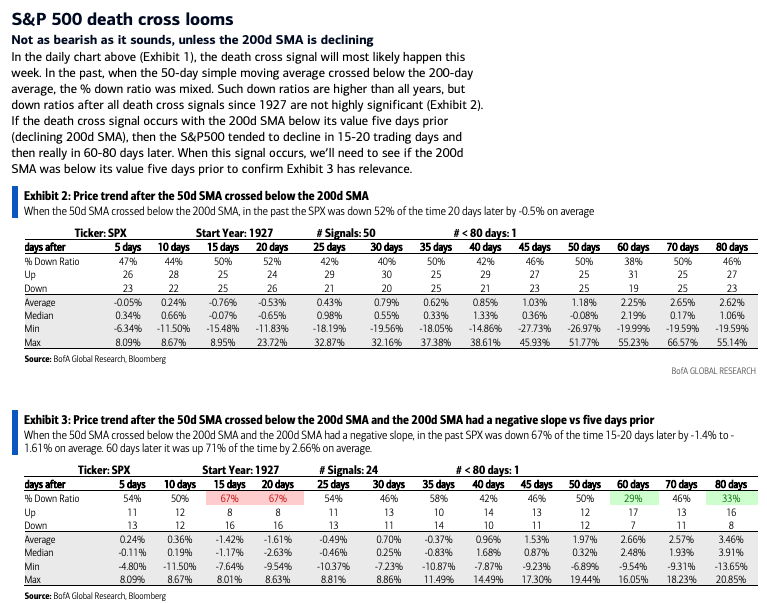
SPX Death Cross: When the 50-day SMA crosses below the 200-day SMA, a death cross signal is triggered. Historically, the SPX has experienced 50 such signals with inconclusive trends thereafter. If the 200-day SMA is declining when the signal occurs, the SPX tends to decline over the next 15-20 trading days and rises 60 to 80 trading days later. We need to monitor if the 200-day SMA is declining when the signal occurs to assess its significance, suggesting a potential retest of the YTD lows in Q2.
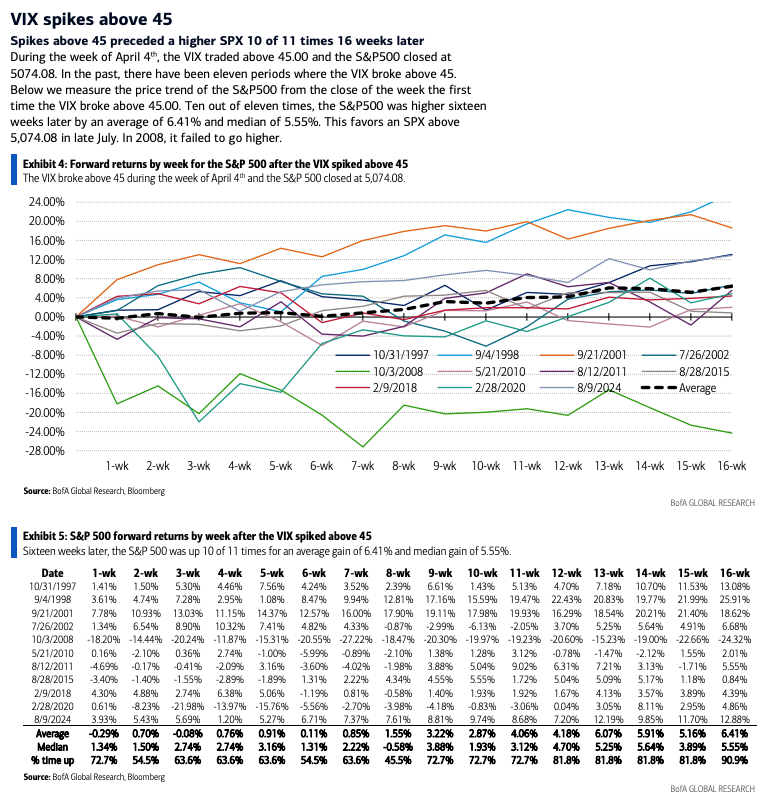
VIX Influence: During the week of April 4th, the VIX traded above 45.00, and the S&P 500 closed at 5,074.08. Historically, when the VIX breaks above 45, the S&P 500 rises sixteen weeks later by an average of 6.41% and a median of 5.55%, outperforming all 16-week periods following April 4. This suggests a favorable outlook for the SPX above 5,074.08 by late July, with 2008 being the exception.
SPX Weekly: The SPX found support at the 1Q22 highs around 4,800-4,850. The 14-week RSI reached oversold levels, and now price and momentum are rebounding. The rising 200-week SMA is at 4,679. If the index falls below this, the risk extends to 4,608 and 4,506.
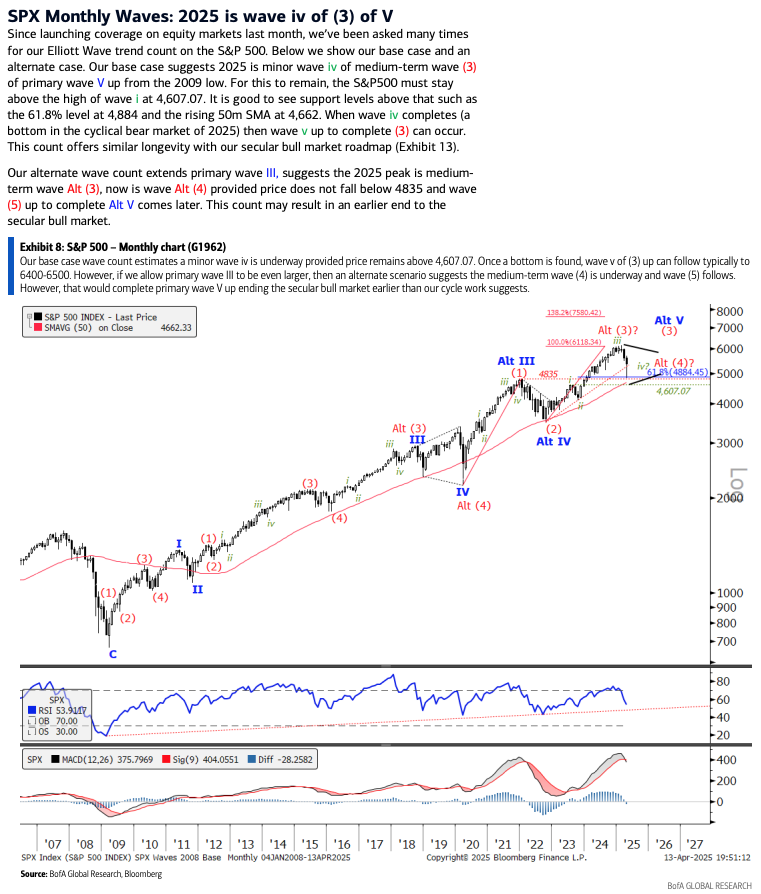
SPX Monthly Waves: Our base case wave count indicates minor wave iv of medium-term wave (3) of primary wave V up from the 2009 low. For this scenario to hold, the S&P 500 must remain above the wave i high at 4,607.07. An alternate wave count is also considered.
SPX Quarterly: Cyclical bear markets tend to revert near the 20-quarter SMA, currently at 4,558 and rising. Ideally, if this average is tested, it should occur in Q3 when it is above 4,607.07 to maintain our base case monthly chart wave count.

Disclaimer: The material provided is for information purposes only and should not be considered as investment advice. The views, information, or opinions expressed in the text belong solely to the author, and not to the author’s employer, organization, committee or other group or individual or company.
Past performance is not indicative of future results.
High Risk Warning: CFDs are complex instruments and come with a high risk of losing money rapidly due to leverage. 71% and 74% of retail investor accounts lose money when trading CFDs with Tickmill UK Ltd and Tickmill Europe Ltd respectively. You should consider whether you understand how CFDs work and whether you can afford to take the high risk of losing your money.
Futures and Options: Trading futures and options on margin carries a high degree of risk and may result in losses exceeding your initial investment. These products are not suitable for all investors. Ensure you fully understand the risks and take appropriate care to manage your risk.
Patrick has been involved in the financial markets for well over a decade as a self-educated professional trader and money manager. Flitting between the roles of market commentator, analyst and mentor, Patrick has improved the technical skills and psychological stance of literally hundreds of traders – coaching them to become savvy market operators!