S&P500 Daily Action Areas & Price Targets 12/6/26
S&P500 Daily Action Areas & Price Targets 12/6/26
***QUOTING ES1! FOR CASH US500 EQUIVALENT LEVELS, SUBTRACT POINT DIFFERENCE***
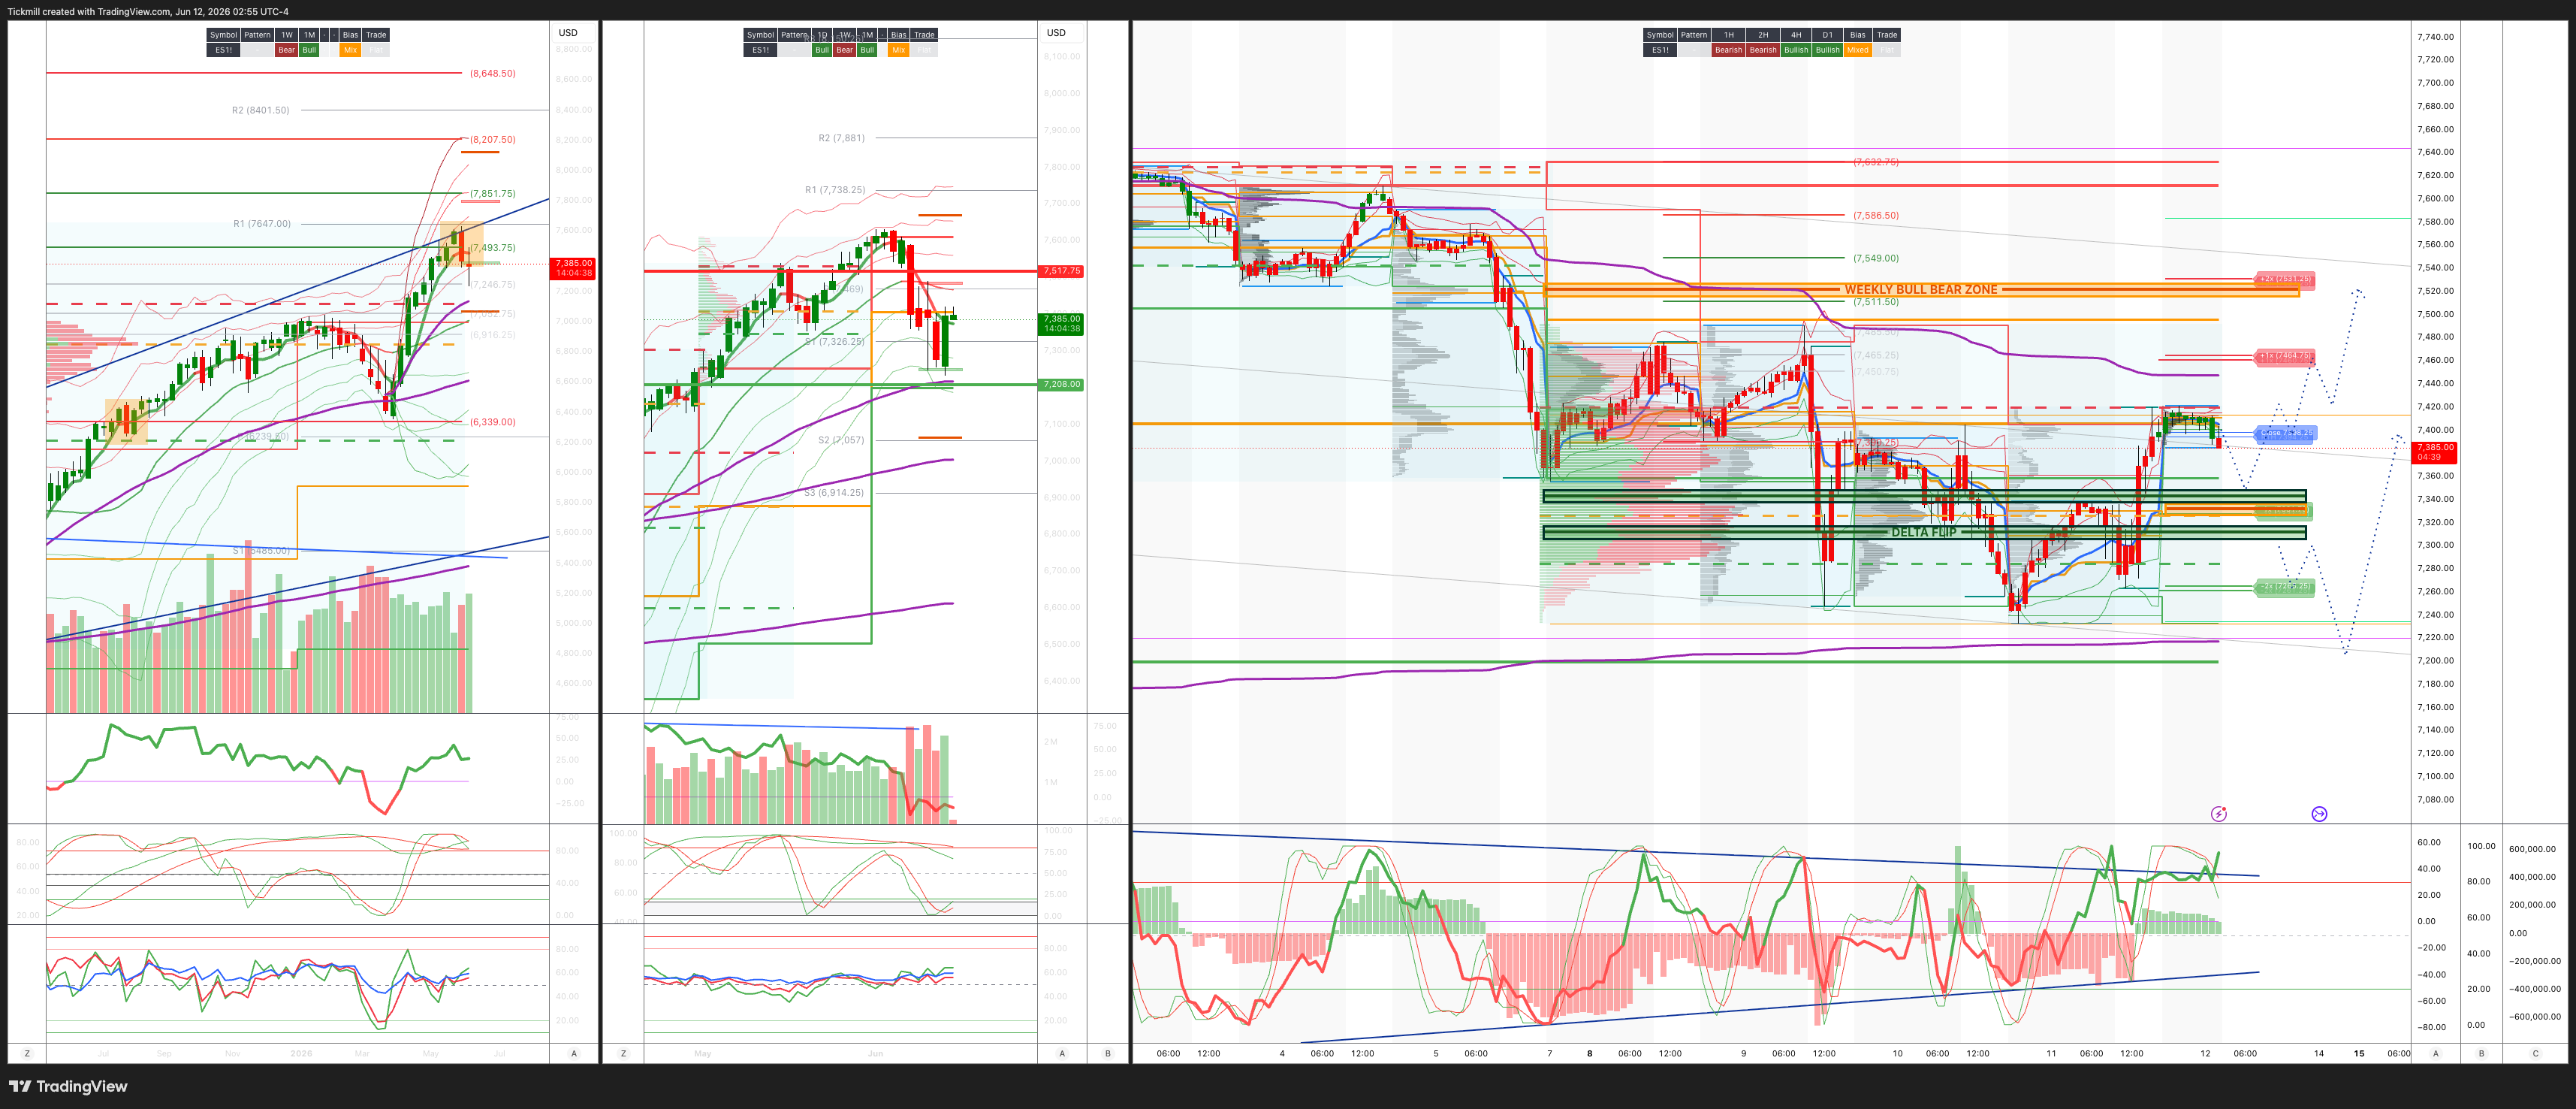
WEEKLY BULL BEAR ZONE 7515/25
WEEKLY RANGE RES 7517 SUP 7208
June MOPEX Straddle: 274pt range implies a OPEX to OPEX range of [7134, 7683]
June QOPEX Straddle is 546.4pt giving us a range of [5960,7052]
JHEQX Q2 Collar 6189/6290 - 6865/6955
DEC2025 OPEX to DEC2026 OPEX is 945 points giving us a range of [5889,7779]
SPX PUT/CALL RATIO 1.06 (The numbers reflect options traded during the current session. A put-call ratio below 0.7 is generally considered bullish, and a put-call ratio above 1.0 is generally considered bearish)
DAILY VWAP BULLISH 7375
WEEKLY VWAP BEARISH 7477
MONTHLY VWAP BULLISH 7036
DAILY STRUCTURE - OTFL 7404
WEEKLY STRUCTURE - TBC
MONTHLY STRUCTURE - OTFH - 7199
Balance: This refers to a market condition where prices move within a defined range, reflecting uncertainty as participants await further market-generated information. Our approach to balance includes favouring fade trades at the range extremes (highs/lows) while preparing for potential breakout scenarios if the balance shifts.
One-Time Framing Higher (OTFH): This represents a market trend where each successive bar forms a higher low, signalling a strong and consistent upward movement.
One-Time Framing Lower (OTFL): This describes a market trend where each successive bar forms a lower high, indicating a pronounced and steady downward movement.
DAILY BULL BEAR ZONE 7340/30
GAMMA FLIP 7344
DELTA FLIP 7310
DAILY RANGE RES 7466 SUP 7330
2 SIGMA RES 7534 SUP 7262
VIX BULL BEAR ZONE 19
TRADES & TARGETS
LONG ON REJECT/RECLAIM DAILY BULL BEAR ZONE TARGET DAILY RANGE RES
***ADDITIONAL SETUPS & TARGETS HIGHLIGHTED ON THE CHARTS***
(I FADE TESTS OF 2 SIGMA LEVELS ESPECIALLY INTO THE FINAL HOUR OF THE NY CASH SESSION AS 90% OF THE TIME WHEN TESTED THE MARKET WILL CLOSE ABOVE OR BELOW THESE LEVELS)
GOLDMAN SACHS TRADING DESK VIEW - ‘Peace Hopes & CAPEX’
The session was a violent risk-on reversal driven by geopolitical de-escalation, lower oil, lower yields, and a sharp unwind of near-term hedges. The S&P rose 1.75% to 7,394, the NDX surged 3.29% to 29,446, the Russell gained 3.02%, and the Dow rose 1.86%. VIX fell back below 20, crude dropped more than 4% to $86.20, and the 10-year yield declined nearly 10bps to 4.46%. The immediate catalyst was Trump saying the Iran bombing was cancelled and Tehran approving a draft agreement to extend the ceasefire. That removed a major near-term tail risk and allowed the market to refocus on lower energy prices, lower rates volatility, and the still-intact bull trend.
The rally was led by the same areas that had been under the most pressure. Nasdaq and high-beta momentum sharply outperformed, with the high-beta momentum pair up 7.86%, its largest one-day rally since March 2021. This confirms that the prior drawdown was heavily positioning-driven rather than a broad fundamental liquidation. Shorts were squeezed, hedges were monetized, and levered/high-beta exposures snapped back quickly. The fact that NDX spot and vol both outperformed speaks to the instability of the tape: investors are chasing the rebound, but realized volatility remains high enough that Nasdaq optionality is still in demand.
The cross-asset backdrop was very supportive. Oil’s failure to rally despite weeks of escalation had already suggested that barrels were still moving through the Strait of Hormuz. The ceasefire headlines reinforced that view and crushed the geopolitical risk premium. Lower crude is important because it reduces the inflation impulse, supports real household income, eases margin pressure, and gives the Fed less reason to lean hawkishly against energy-driven inflation. The 10-year yield falling to 4.46% also helped long-duration equities and provided relief to the AI and growth complex after several sessions of pressure from sticky real yields.
Flows were constructive but still showed a clear preference for broadening rather than a pure chase back into Tech. Floor activity rose to 7 out of 10 and finished better to buy, driven by asset-manager demand in Health Care, Financials, and Consumer, while asset managers still supplied Tech. Hedge funds were slight net buyers, with demand in Discretionary, Tech, and Industrials, and smaller supply in Communication Services. In other words, the index rally was dominated by Nasdaq and high-beta momentum, but the underlying sponsorship continues to favor a broader sector rotation.
ORCL was the important exception, falling 8% despite the strong tape. The issue was not weak top-line demand, but that heavy spending overshadowed strong results. This goes directly to the central AI-capex debate. The market is no longer just asking whether AI demand is real; it is asking how much capital must be spent to capture that demand, how it will be financed, and who ultimately earns the return. That is why AI infrastructure can remain structurally bullish while individual stocks still face sharp drawdowns when capex intensity, issuance, or margin pressure disappoint investors.
The Ryan Hammond team note reinforces that AI capex expectations may still be too low. Consensus 2027 hyperscaler capex is around $920bn, implying only 22% growth after 84% growth in 2026, but analysts have underestimated capex by an average of 45 percentage points in each of the last three years. More realistic scenarios could point toward $1.1tn if incremental investment reaches 2–3% of GDP, and potentially as much as $1.4tn in an upside case based on cash-flow generation and investment-grade credit capacity. That is supportive for AI infrastructure earnings, but also raises volatility risk because valuations, positioning, financing needs, and return dispersion are all elevated.
The derivatives tape showed near-term tail risk being repriced lower. Skew was crushed across the board, most notably in the front end of SPX and RUT, while RUT and SPX fixed-strike vols finished slightly offered in the front end and little changed further out. That suggests the market removed immediate geopolitical crash risk but did not fully abandon medium-term hedging demand. The implied move through the end of the week remained 0.95%, so investors still expect meaningful price action even after the relief rally.
ADBE’s post-close weakness shows that software remains a separate and more complicated debate. The stock fell despite already being down roughly 20% into the print and near eight-year lows. The headline looked like a beat, but the CFO departure, ARR outlook details, and persistent concerns about AI monetization and disruption weighed on sentiment. Unlike AI infrastructure, where the question is whether capex is too high or still too low, software faces the harder question of whether AI is a tailwind, a margin tool, or a threat to existing seat-based business models.
The bull market remains intact, but the tape is increasingly violent. Geopolitical de-escalation, lower oil, and lower yields triggered a powerful rebound in the same high-beta and AI-linked names that had been hit hardest. However, the underlying fragilities have not disappeared. AI infrastructure valuations are elevated, positioning remains crowded, capex expectations are uncertain, buyback blackout is approaching, and liquidity is thinner than normal. The right framework remains constructively long but hedged: stay with high-conviction liquid longs, participate in the broadening trade, and continue to own convexity because summer trading conditions are likely to remain gap-prone..
Disclaimer: The material provided is for information purposes only and should not be considered as investment advice. The views, information, or opinions expressed in the text belong solely to the author, and not to the author’s employer, organization, committee or other group or individual or company.
Past performance is not indicative of future results.
High Risk Warning: CFDs are complex instruments and come with a high risk of losing money rapidly due to leverage. 71% and 74% of retail investor accounts lose money when trading CFDs with Tickmill UK Ltd and Tickmill Europe Ltd respectively. You should consider whether you understand how CFDs work and whether you can afford to take the high risk of losing your money.
Futures and Options: Trading futures and options on margin carries a high degree of risk and may result in losses exceeding your initial investment. These products are not suitable for all investors. Ensure you fully understand the risks and take appropriate care to manage your risk.
Patrick has been involved in the financial markets for well over a decade as a self-educated professional trader and money manager. Flitting between the roles of market commentator, analyst and mentor, Patrick has improved the technical skills and psychological stance of literally hundreds of traders – coaching them to become savvy market operators!